


 Comprehensive weather insights help safeguard your operations and drive confident decisions to make everyday mining operations as safe and efficient as possible.
Precipitation Frequency Estimates – What are they and why should I care?
Overview
It seems every time an extreme rainstorm results in flooding, inquiring minds want to know the rarity of the rainfall in terms of a frequency or likelihood (i.e., probability of occurring again). In fact, to many, especially those outside the weather/climate community, the equivalent frequency of the storm is more meaningful than the actual amount of precipitation. For example, if I said “it rained 4.50 inches in one day in Denver,” you might not be as impressed as if I said “yesterday’s one day precipitation was a 100-year event in Denver.” In stark contrast, 4.50 inches in one day in Miami, Florida represents an amount that occurs, on average, every single year. Regardless of the frequency of the precipitation, it does not equate to the same frequency of the ensuing flood. The degree of flooding is largely the result of the rainfall, but other important factors such as soil type, antecedent moisture conditions, slope, vegetation, season, snowpack, regulations on water flow, and other environmental factors all influence the degree of flooding. In other words, under the right conditions, such as a burn scar where vegetation has been removed, a 5-year precipitation event can cause a 100-year flood. Understanding the complex terminology, background, and uses of frequency-based products is difficult. Here, we present a brief summary.
Terminology, Semantics & Definitions
By definition, a precipitation frequency estimate (PFE) is defined as the depth of precipitation at a specific location for a specific duration that has a certain probability of occurring in any given year. We always refer to a PFE with an associated duration and location, being careful not to categorize the rarity of a “storm.” For example, the PFE for a 24-hour precipitation amount in Denver, CO with a 1% chance of occurring in any given year is 4.50 inches. PFEs are defined in terms of an Average Recurrence Interval (ARI) or Annual Exceedance Probability (AEP); AEPs are often translated into a percent chance of occurring in any given year to alleviate confusion. The term “return period” is equivalent to the ARI, but not widely used since it gives the false sense of an events only occurring every x number of years, when actually it is the average number of years between exceedances of a given precipitation amount; implicit in this definition is the years between exceedances are generally random. For instance, in Denver, 4.50 inches of precipitation over a 24-hour period happens on average every 100 years. To emphasize the fact that 4.50 inches in 24-hours could fall several times in a year or over the course of a few years, the AEP is often used to describe the rareness. An AEP is the probability 4.50 inches (or more) in 24-hours will fall during the year; in our example, that equates to probability of 0.01 or 10E-2 in scientific notation. The AEP = 1/ARI. For convenience, AEPs are often multiplied by 100 to convert them into a percent chance of occurring during a given year; so an AEP of .01 equates to a 1% chance. In other words, there is a 1% chance that an event will equal or exceed a certain PFE at a specific location and duration during a given year. And lastly, some like to translate AEPs/ARIs into an odd, similar to winning the lottery for example. In this context, the odds of a 100-year event occurring in any given year is 1 in 100. Below is an interactive table that translates between ARI, AEP, percent chance and odds. Keep in mind we can’t use the simple relationship ARI = 1/AEP for frequent events; ARIs greater than 10 years are very closely approximated by 1/AEP (the reciprocal of the AEP).
| ARI (years) |
AEP | AEP (scientific notation) |
Percent chance in any given year |
Odds in any given year |
|---|---|---|---|---|
| 1 | .632 | 1.00E-00 | 100% | 1 in 1 |
| 2 | .393 | 2.00E-00 | 50% | 1 in 2 |
| 5 | .181 | 5.00E-00 | 20% | 1 in 5 |
| 10 | 0.095 | 1.00E-01 | 10% | 1 in 10 |
| 25 | 0.040 | 2.50E-01 | 4% | 1 in 25 |
| 50 | 0.020 | 5.00E-01 | 2% | 1 in 50 |
| 100 | 0.010 | 1.00E-02 | 1% | 1 in 100 |
| 200 | 0.005 | 2.00E-02 | 0.5% | 1 in 200 |
| 500 | 0.002 | 5.00E-02 | 0.2% | 1 in 500 |
| 1,000 | 0.001 | 1.00E-03 | 0.1% | 1 in 1,000 |
| 10,000 | 0.0001 | 1.00E-04 | 0.01% | 1 in 10,000 |
| 100,000 | 0.00001 | 1.00E-05 | 0.001% | 1 in 100,000 |
| 1,000,000 | 0.000001 | 1.00E-06 | 0.0001% | 1 in 1 million |
| 10,000,000 | 0.0000001 | 1.00E-07 | 0.00001% | 1 in 10 million |
| 100,000,000 | 0.00000001 | 1.00E-08 | 0.000001% | 1 in 100 million |
| 1,000,000,000 | 0.000000001 | 1.00E-09 | 0.0000001% | 1 in 1 billion |
AEP is defined as the “probability that a given rainfall total accumulated over a given duration will be exceeded in any one year.” AEP relates to ARI as follows:
![]()
For a more information, see Laurenson, E.M. (1987). Back to Basics on Flood Frequency Analysis by E.M. Laurenson, Civil Engineering Transactions, 1987, pp. 47 to 53.
It is important to understand there is no regularity of occurrence of rare events; sequences of low probability events occurring in a relatively short period of time are a natural part of the chaotic atmosphere. This means several 100-year or rarer storms for a specific duration and location can theoretically occur during the same year. The same can be said about long periods of time lacking high-probability or common events. Everything here is not to be confused with the daily weather forecasts that provide a probability of precipitation (e.g. “a 40% chance of rain”). A forecast probability of precipitation (PoP) conveys how much of the forecast area expects to see measurable (>= 0.01 inches) precipitation.
History & Background
PFEs are calculated using historical precipitation gauge data, which can date back to the late 1800s, and statistical procedures used to estimate (extrapolate) PFEs beyond AEPs of 1 in 100. The calculation and mapping of PFEs have historically been the responsibility of the National Oceanic and Atmospheric Administration (NOAA), who published numerous technical papers, documents and atlases in the 1960s, 70s and 80s. However, more recently (since 1998), NOAA’s Hydrometeorological Design Studies Center has been updating the PFEs across the United States as part of NOAA Atlas 14; the results are published through the Precipitation Frequency Data Server (Perica et al., 2013). NOAA Atlas 14 provides AEPs out to 1 in 1,000 which lends itself to users of more common precipitation events and not high-risk dams, nuclear power plants or other sensitive hydrologic structures to very extreme precipitation events. As a general rule of thumb, traditional statistics provide robust ARIs two times the period of record of the gauge data; for instance, a precipitation gauge with 50 years of daily measurements can reliably support PFEs out to 100-years (1 in 100). Through the 1980s, statistical methods largely conformed to this rule-of-thumb, but pressure from users (e.g. U.S. Army Corps of Engineers) drove innovative statistical methods to estimate AEPs well beyond 1 in 100. Buried in the details of our approach to computing PFEs are robust statistical relationships that support the computation of PFEs out 1 in 1 million. It is important to understand that these statistical analyses are not an expression of over-confidence in the statistical approach, but rather to make comparisons with PMP and to assess the behavior of the frequency curves and uncertainty.
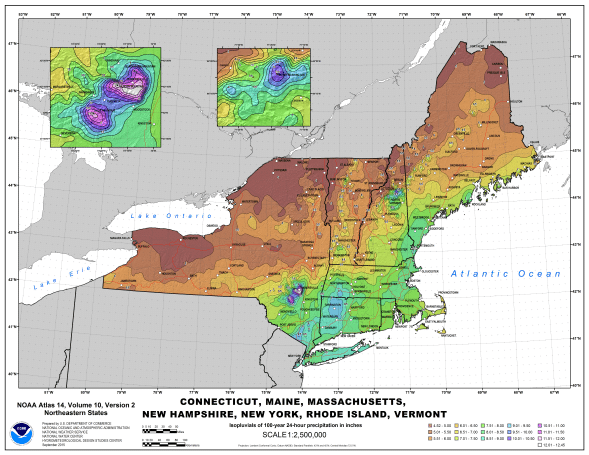
NOAA Atlas 14 cartographic depiction of the 100-year 24-hour precipitation in New York.
Users of Precipitation Frequency Estimates
Billions of dollars are spent each year, including your tax dollars, in the U.S. designing, building and operating infrastructure to withstand the forces of heavy precipitation and floods. The design of parking lots to dams require PFEs for a hydrologist to use in analyzing the flow of flood waters over, into and around structures. The goal is to size retention ponds, culverts, diversion structures, drains, pipes, and other water conveyance systems appropriately to prevent flooding in populated areas. Given the wide range of climate and weather across the U.S., PFEs are needed for every location to ensure safe and effective designs. Small structures, such as parking lots, culverts and bridges are designed to more-frequent events, on the order of a 2-year to 20-year ARI. The exact design criteria are governed by cities, municipalities or local governments. On the other hand, extremely rare (>1000-year ARIs) are required of dam and nuclear power plants; the Federal Energy Regulatory Commission (FERC) and Nuclear Regulatory Commission (NRC) are the primary regulators of these structures. If lives are at stake as a result of a dam or nuclear power plant failure, the legislation and FERC or NRC guidelines often require the design to adhere to the Probable Maximum Precipitation (PMP). PMP is defined as “… the greatest depth of precipitation for a given duration meteorologically possible for a given size storm area at a particular location at a particular time of year, with no allowance made for long-time climatic trends” (WMO, 1986). PMP is a highly conservative estimate of precipitation that should never be exceeded and represent probabilities on the order of 1 in 100,000 to 1 in 1 million. Buried in the details of our approach to computing PFEs are robust statistical relationships that support the computation of PFEs out 1 in 1 million. It is critically important to understand that these statistical analyses are not an expression of over-confidence in the statistical approach, but rather to make comparisons with PMP and to assess the behavior of the frequency curves and uncertainty.
Using PFEs published by NOAA’s Hydrometeorological Design Center in conjunction with our near real-time Quantitative Precipitation Estimates (QPEs), MetStat, now DTN, translates the QPEs into equivalent ARIs. This provides an objective means to monitor precipitation and instill situational awareness of extreme storms capable of producing flash flooding. The same is done with Quantitative Precipitation Forecasts (QPFs) to provide ARI forecasts at 6- and 24-hour durations out 5 days into the future, thereby providing a powerful tool for ascertaining where rare storms are forecast to occur. These near real-time and forecast ARI products are particularly useful for dam owners, weather forecasters, flood control district managers, mining operators, water conveyance operators, combined sewer overflow system managers, energy clients, agriculture clients, insurance companies, media outlets, data scientists and hydrologic modelers.
The Ultimate Goal
Although the ARI or AEP of precipitation is fascinating and requires a much greater effort to calculate than most people realize or appreciate, the ultimate goal of most precipitation frequency studies is to support hydrologic studies striving to quantify the degree or risk of flooding at a location. The risk of flooding as a result of a dam over-topping is easily conveyed through a Hydrologic Hazard Curve (HHC), which is plot that relates, for example, maximum reservoir level to AEP. An example HHC is shown below; creating a HHC is an enormous effort, but can have tremendous impacts on dam design and operation. DTN has been involved with numerous projects to this effect and is advancing the science by separating PFEs by storm type (e.g., mid-latitude cyclone versus tropical storm) for hydrologic modeling.
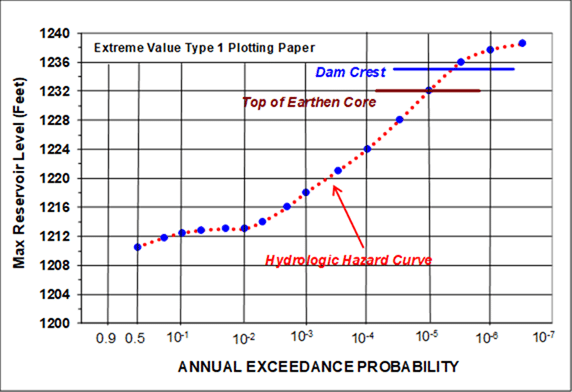
Example of Hydrologic Hazard Curve for Maximum Reservoir Level.
What about Climate Change?
The impact of climate change on PFEs as been the subject of numerous research efforts, but a standard of practice has not yet been established to adjust PFEs accordingly (Cheng 2017, Kunkel 2013, Perica 2013, Buishand 2009). In fact, the World Meteorological Organization does not call for explicit inclusion of climate change effects in PMP or rare PFE estimation. Until a standard of practice is established, the effects of climate change can be considered using uncertainty bounds of the PFEs. Providing uncertainty bounds allows users and regulators to select the upper bound of the PFEs for purposes of regulation, design and/or operation to account for possible climate change. Another important consideration, which is substantiated by findings from some of our studies, suggests other hydro-meteorological impacts of climate change are more impactful than actual changes in the PFEs. For instance, one could imagine that climate change could cause mountain snowpacks to melt-out earlier in the season and before the typical time of year when extreme springtime storms occur, thereby actually lessening the flood potential under a warmer climate regime. The take-away is that climate change has several feedbacks that need to be considered when accounting for climate change in PFEs and subsequent hydrologic analyses.
Communication is Key
Effective communication of extreme precipitation, in a probabilistic perspective, is a challenge we face almost daily at DTN and is largely the motivation of this blog. The most common communication breakdown is the difference between precipitation ARI/AEP and flood ARI/AEP; it is not unusual for the newspaper headline to read “100-year Flood Inundates City” when in reality the rainfall was a 100-year ARI, but the flood may have been a 250-year flood or a 25-year ARI depending on antecedent conditions. The other misconception is that 100-year storms appear to be happening far more frequently than what the term “100-year” ARI would imply. The fact is there are hundreds of 100-year storms in the United States each year, but rarely at the same exact location. Trends of 100-year events is a good topic for a future blog, but will first require substantial analysis. The other element of communicating extreme events is the size of the storm or footprint of extreme precipitation. Combining the size and rarely of storms into a storm severity index has been attempted by several researchers, but an industry-wide standard has yet to be adopted by NOAA’s National Weather Service (Grisa 2014, Waters 2014).
Final Thoughts
Hopefully, this succinct summary provides a foundational understanding of the terminology and communication of precipitation frequency estimates. The tools, data, and expertise needed to conduct precipitation frequency analyses represent a very narrow niche in the meteorological field. DTN has been a leader in this niche since 1994 and, with strategic partners, continues to develop state-of-the-practice methods for advancing the science of extreme precipitation. For additional details on the development of PFEs, visit our frequency analysis page.
If you have any questions, please feel free to each out to us via our Contact Page.