Epic Flooding in the Northern Plains Destroys Dam, Threatens Nuclear Plant
The “Bomb Cyclone” that made national headlines during the middle part of last week was a spectacular example of what a strong late-winter/early-spring storm can be in the central United States. It truly had it all: severe thunderstorms in the southeastern United States, strong non-thunderstorm winds across the southern plains, and blizzard conditions across the northern plains. As noted in the Tweet below from Boston meteorologist Eric Fisher, the storm made for some truly spectacular satellite images.
However, midlatitude storms only achieve such intensity when they have a large amount of energy to feed on, and that usually means big temperature gradients. In this case, the warm sector of the Bomb Cyclone brought temperatures in the 50s and 60s °F to swaths of Nebraska, South Dakota and Iowa that had dense, water-rich snowpack on the ground from a cold and snowy February and early March. This warm air was also rich in moisture and, being in the vicinity of such a strong cyclone, was strongly lifted to produce widespread moderate-to-heavy rain across the region. The result was a truly disastrous combination of rapid snowmelt, heavy rain, and moisture trying to escape through ice-clogged rivers and creeks, leading to intense and locally sudden flooding across the region. The rather dramatic melt-out of the snowpack across the region is illustrated in Figure 1 below, with 6-12″ of very high water content snow melting out in short order across the middle Missouri River valley.
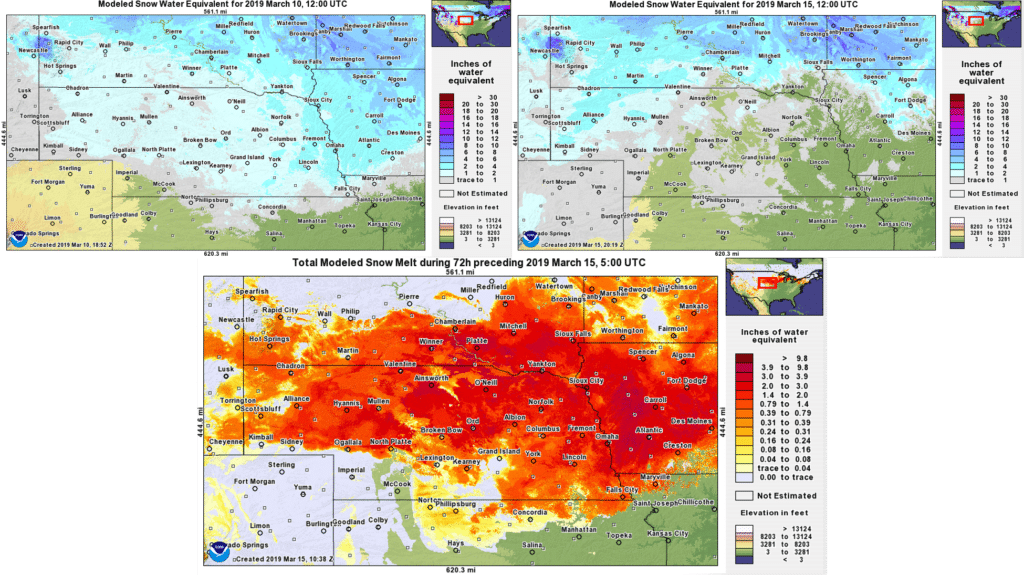
Figure 1. (Top left) The liquid equivalent value (in) of snowpack on the morning of 10 March 2019. Note the 2-4″ values across much of the Missouri River valley. (Top right) Snow water equivalent remaining on the ground after the passage of the storm on the morning of 15 March 2019, with snowpack all but eliminated in NE and IA. (Bottom) The 72-hour change in snowpack from around midnight local time on the mornings of 12-15 March 2019, indicating that between 0.75″ and 4″ of snow water melted out across much of NE, IA, and southeastern SD.
Generally speaking, rainfall from this system was not particularly large. However, the magnitude of the flood event warranted an analysis with MetStorm. Our preliminary rainfall analysis results are below in Figure 2. Note that these are very preliminary results using mostly automated quality control procedures. Additionally, the occurrence of snow during the later portion of the event, especially over the northwestern portion of the analysis region, presents difficulties since many automated gauges are not equipped to automatically melt snow and convert to liquid amounts.
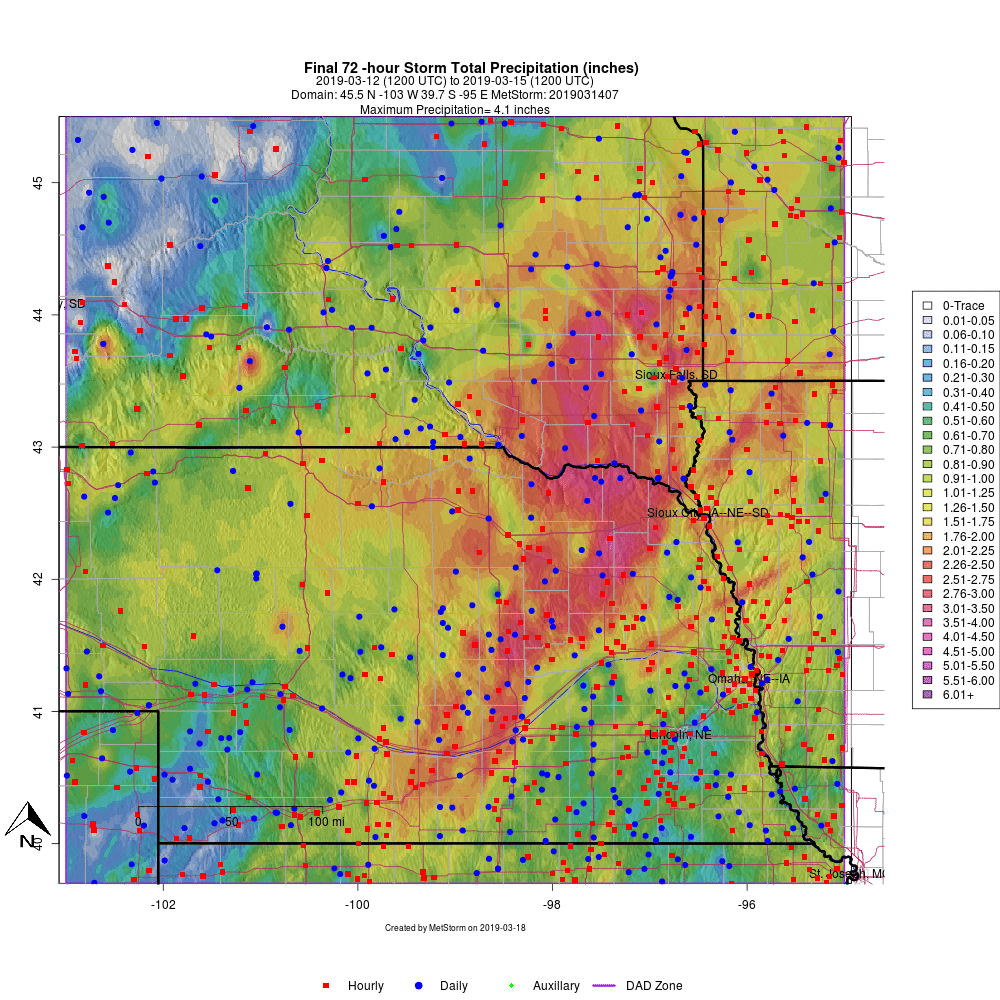
Figure 2. Three-day precipitation totals from our preliminary MetStorm analysis, depicting the heaviest rain as occurring over northeastern Nebraska and southeastern South Dakota. Rainfall totals of 1-4″ were observed across virtually the entire region.
Rainfall totals of 1-4″ over a 2-3 day period in this region are not particularly extreme; we calculated the maximum average recurrence interval across this region at just 7 years, and most places were more frequent than 2 years. However, these totals were effectively doubled by the melt-out of another 1-4″ of liquid from the dense snowpack that covered this region. Further compounding the flood problem are frozen soils and ice jams, which slow the infiltration of water into the ground and cause sudden blockages of waterways as surface ice begins the process of breaking up. A good example of ice jam flooding can be seen in the video in the embedded Tweet below.
Perhaps the most dramatic consequence of the flooding across the plains last week was the failure of Spencer Dam along the Niobrara River in northeastern Nebraska. The dam became overwhelmed by the volume of water and the pounding of chunks of ice against its gates and suddenly gave way on the morning of 14 March. As it did so, an enormous flood wave rushed downstream, causing the depth at the Verdel, NE river gauge to spike 11 feet before failing and causing devastation to the small towns in its wake.
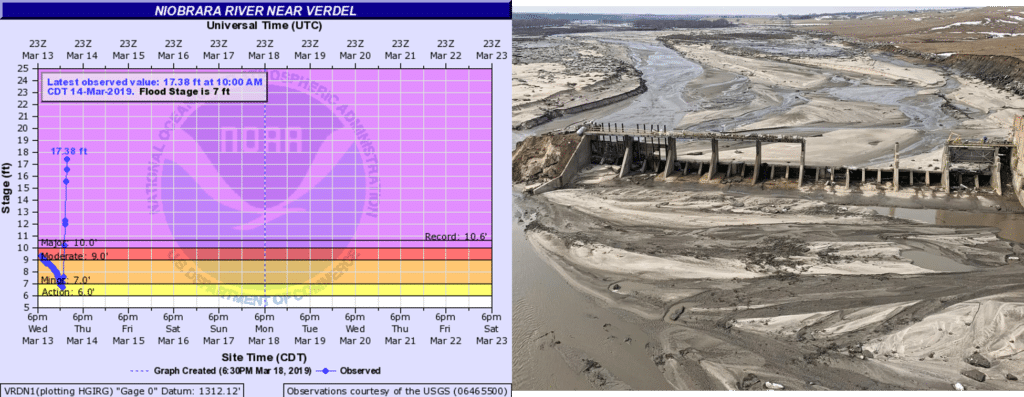
Figure 3. (Left) The hydrograph depicting the height of the water along the Niobrara River in Verdel, NE, showing the sudden rise in levels after Spencer Dam’s failure on the morning of 14 March. Image courtesy the Advanced Hydrologic Prediction Service. (Right) Spencer Dam following its failure. Image from the Lincoln Journal-Star.
Other concerning complications from flooding last week revolved around the potential flooding of the Cooper Nuclear Plant near Brownville, Nebraska. After flood forecasts initially suggested water may enter the plant, the breach of some levees upstream alleviated the flood height and spared the plant. Helicopters had to be used to shuttle workers and supplies in and out though, as waters were sufficiently high to cut off all land access to the plant for a period of time.
This devastating event is exactly the kind of disaster that MetStat works to help mitigate as much as possible. Our precipitation frequency studies and probable maximum precipitation estimates help dam and nuclear power plant owners and operators (among others) to understand the flood risks they face. We wish everyone affected by these events the best in their recovery efforts. Watch this space for additional storm analyses as the spring season unfolds.


 Comprehensive weather insights help safeguard your operations and drive confident decisions to make everyday mining operations as safe and efficient as possible.
 Learn how to optimize operations with credible weather and environmental intelligence. From aviation safety to environmental compliance, our comprehensive suite of solutions delivers real-time insights, advanced forecasting, and precise monitoring capabilities.